OK.Wahl
Internetpräsentation
Version 2.2.7
Vorläufiges Ergebnis zur Bezirkswahl 2013 am 15.09.2013
Stimmkreis Kronach, Lichtenfels - Landkreis Lichtenfels - Gemeinde Hochstadt a. Main
Es wurden alle Stimmbezirke ausgewertet.
 Diagramm
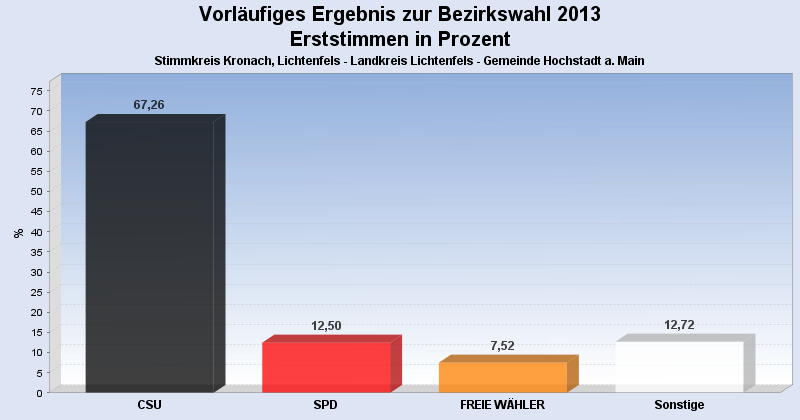
 Seitenanfang
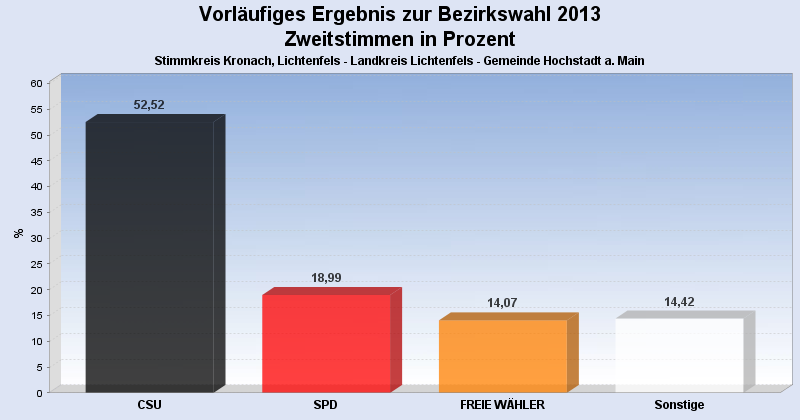
Wahlbeteiligung, Stimmzettel, Stimmen
| Wahlbeteiligung: | 67,11% |
|---|---|
| Stimmberechtigte: | 1.359 |
| Wähler: | 912 |
| Ungültige Erststimmen: | 8 |
| Gültige Erststimmen: | 904 |
| Ungültige Zweitstimmen: | 38 |
| Gültige Zweitstimmen: | 874 |
Erststimmen nach Wahlvorschlag
| Partei | Erststimmen | Prozent | |
|---|---|---|---|
| 1 | Meißner, Christian (CSU) | 608 | 67,26% |
| 2 | Marr, Oswald (SPD) | 113 | 12,50% |
| 3 | Löffler, Gerhard (FREIE WÄHLER) | 68 | 7,52% |
| 12 | Konrad, Stefan (DIE FRANKEN) | 21 | 2,32% |
| 13 | Bassing, Stefan (PIRATEN) | 20 | 2,21% |
| 4 | Wesolek, Helmut (GRÜNE) | 16 | 1,77% |
| 9 | Hühnlein, Johannes (NPD) | 15 | 1,66% |
| 7 | Müller, Carita (ÖDP) | 13 | 1,44% |
| 6 | Malm, Stefan (DIE LINKE) | 12 | 1,33% |
| 11 | Köstner, Petra (FRAUENLISTE) | 8 | 0,88% |
| 5 | Nehmzow, Irmgard (FDP) | 5 | 0,55% |
| 8 | Knirsch, Horst (REP) | 3 | 0,33% |
| 10 | Sedlmeyer, Gunther (BP) | 2 | 0,22% |
Zweitstimmen nach Wahlvorschlag
| Partei | Zweitstimmen | Prozent | |
|---|---|---|---|
| 1 | CSU | 459 | 52,52% |
| 2 | SPD | 166 | 18,99% |
| 3 | FREIE WÄHLER | 123 | 14,07% |
| 4 | GRÜNE | 22 | 2,52% |
| 9 | NPD | 22 | 2,52% |
| 13 | PIRATEN | 20 | 2,29% |
| 12 | DIE FRANKEN | 14 | 1,60% |
| 6 | DIE LINKE | 14 | 1,60% |
| 5 | FDP | 12 | 1,37% |
| 11 | FRAUENLISTE | 7 | 0,80% |
| 7 | ÖDP | 6 | 0,69% |
| 10 | BP | 6 | 0,69% |
| 8 | REP | 3 | 0,34% |
- Stand: 18.09.2013 09:41:37