OK.Wahl
Internetpräsentation
Version 2.2.7
Vorläufiges Ergebnis zur Bezirkswahl 2013 am 15.09.2013
Stimmkreis Kronach, Lichtenfels - Landkreis Lichtenfels - Stadt Weismain
Es wurden alle Stimmbezirke ausgewertet.
 Diagramm
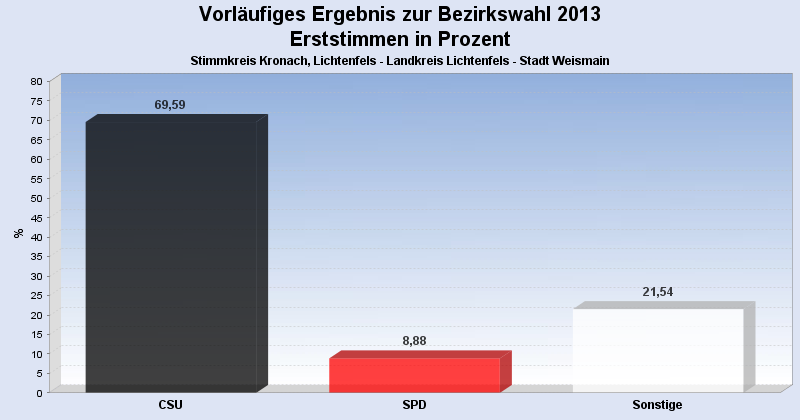
 Seitenanfang
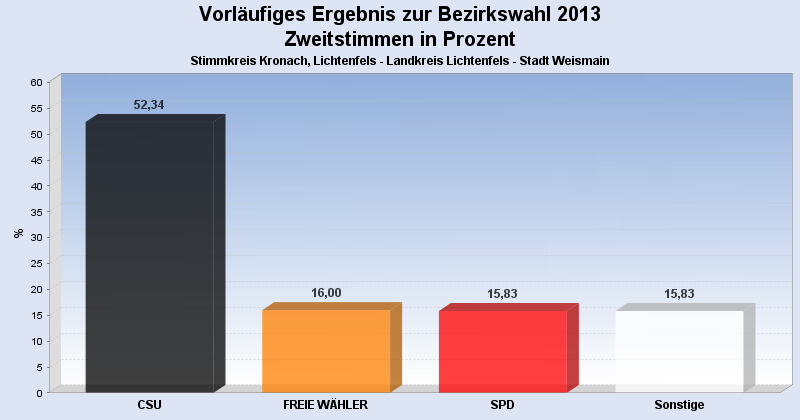
Wahlbeteiligung, Stimmzettel, Stimmen
| Wahlbeteiligung: | 65,11% |
|---|---|
| Stimmberechtigte: | 3.892 |
| Wähler: | 2.534 |
| Ungültige Erststimmen: | 22 |
| Gültige Erststimmen: | 2.512 |
| Ungültige Zweitstimmen: | 52 |
| Gültige Zweitstimmen: | 2.482 |
Erststimmen nach Wahlvorschlag
| Partei | Erststimmen | Prozent | |
|---|---|---|---|
| 1 | Meißner, Christian (CSU) | 1.748 | 69,59% |
| 2 | Marr, Oswald (SPD) | 223 | 8,88% |
| 12 | Konrad, Stefan (DIE FRANKEN) | 104 | 4,14% |
| 3 | Löffler, Gerhard (FREIE WÄHLER) | 96 | 3,82% |
| 5 | Nehmzow, Irmgard (FDP) | 64 | 2,55% |
| 4 | Wesolek, Helmut (GRÜNE) | 63 | 2,51% |
| 9 | Hühnlein, Johannes (NPD) | 60 | 2,39% |
| 7 | Müller, Carita (ÖDP) | 39 | 1,55% |
| 13 | Bassing, Stefan (PIRATEN) | 32 | 1,27% |
| 6 | Malm, Stefan (DIE LINKE) | 32 | 1,27% |
| 11 | Köstner, Petra (FRAUENLISTE) | 23 | 0,92% |
| 10 | Sedlmeyer, Gunther (BP) | 16 | 0,64% |
| 8 | Knirsch, Horst (REP) | 12 | 0,48% |
Zweitstimmen nach Wahlvorschlag
| Partei | Zweitstimmen | Prozent | |
|---|---|---|---|
| 1 | CSU | 1.299 | 52,34% |
| 3 | FREIE WÄHLER | 397 | 16,00% |
| 2 | SPD | 393 | 15,83% |
| 4 | GRÜNE | 86 | 3,46% |
| 9 | NPD | 60 | 2,42% |
| 13 | PIRATEN | 56 | 2,26% |
| 12 | DIE FRANKEN | 49 | 1,97% |
| 5 | FDP | 44 | 1,77% |
| 8 | REP | 31 | 1,25% |
| 6 | DIE LINKE | 26 | 1,05% |
| 11 | FRAUENLISTE | 15 | 0,60% |
| 7 | ÖDP | 13 | 0,52% |
| 10 | BP | 13 | 0,52% |
- Stand: 18.09.2013 09:42:16