OK.Wahl
Internetpräsentation
Version 2.2.7
Vorläufiges Ergebnis zur Bezirkswahl 2013 am 15.09.2013
Stimmkreis Kronach, Lichtenfels - Landkreis Lichtenfels - Gemeinde Redwitz a.d. Rodach
Es wurden alle Stimmbezirke ausgewertet.
 Diagramm
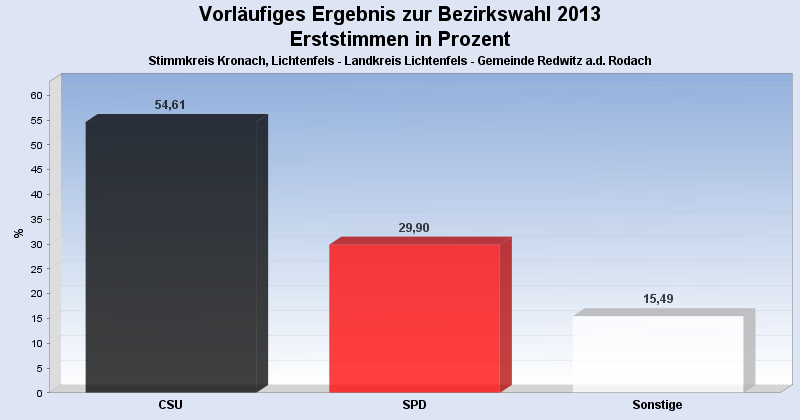
 Seitenanfang
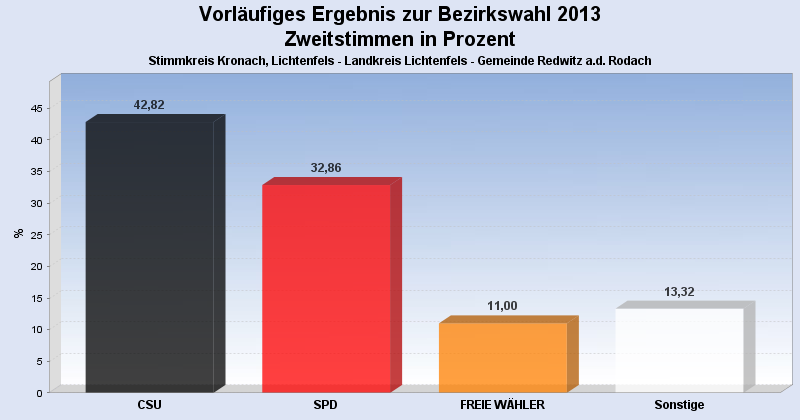
Wahlbeteiligung, Stimmzettel, Stimmen
| Wahlbeteiligung: | 62,67% |
|---|---|
| Stimmberechtigte: | 2.668 |
| Wähler: | 1.672 |
| Ungültige Erststimmen: | 13 |
| Gültige Erststimmen: | 1.659 |
| Ungültige Zweitstimmen: | 35 |
| Gültige Zweitstimmen: | 1.637 |
Erststimmen nach Wahlvorschlag
| Partei | Erststimmen | Prozent | |
|---|---|---|---|
| 1 | Meißner, Christian (CSU) | 906 | 54,61% |
| 2 | Marr, Oswald (SPD) | 496 | 29,90% |
| 3 | Löffler, Gerhard (FREIE WÄHLER) | 67 | 4,04% |
| 9 | Hühnlein, Johannes (NPD) | 40 | 2,41% |
| 12 | Konrad, Stefan (DIE FRANKEN) | 36 | 2,17% |
| 4 | Wesolek, Helmut (GRÜNE) | 29 | 1,75% |
| 13 | Bassing, Stefan (PIRATEN) | 22 | 1,33% |
| 6 | Malm, Stefan (DIE LINKE) | 21 | 1,27% |
| 7 | Müller, Carita (ÖDP) | 18 | 1,08% |
| 11 | Köstner, Petra (FRAUENLISTE) | 7 | 0,42% |
| 10 | Sedlmeyer, Gunther (BP) | 7 | 0,42% |
| 5 | Nehmzow, Irmgard (FDP) | 6 | 0,36% |
| 8 | Knirsch, Horst (REP) | 4 | 0,24% |
Zweitstimmen nach Wahlvorschlag
| Partei | Zweitstimmen | Prozent | |
|---|---|---|---|
| 1 | CSU | 701 | 42,82% |
| 2 | SPD | 538 | 32,86% |
| 3 | FREIE WÄHLER | 180 | 11,00% |
| 9 | NPD | 41 | 2,50% |
| 12 | DIE FRANKEN | 41 | 2,50% |
| 4 | GRÜNE | 37 | 2,26% |
| 13 | PIRATEN | 26 | 1,59% |
| 6 | DIE LINKE | 18 | 1,10% |
| 7 | ÖDP | 15 | 0,92% |
| 11 | FRAUENLISTE | 13 | 0,79% |
| 5 | FDP | 12 | 0,73% |
| 8 | REP | 8 | 0,49% |
| 10 | BP | 7 | 0,43% |
- Stand: 18.09.2013 09:42:11