OK.Wahl
Internetpräsentation
Version 2.2.7
Vorläufiges Ergebnis zur Bezirkswahl 2013 am 15.09.2013
Stimmkreis Kronach, Lichtenfels - Landkreis Lichtenfels - Gemeinde Michelau i.OFr.
Es wurden alle Stimmbezirke ausgewertet.
 Diagramm
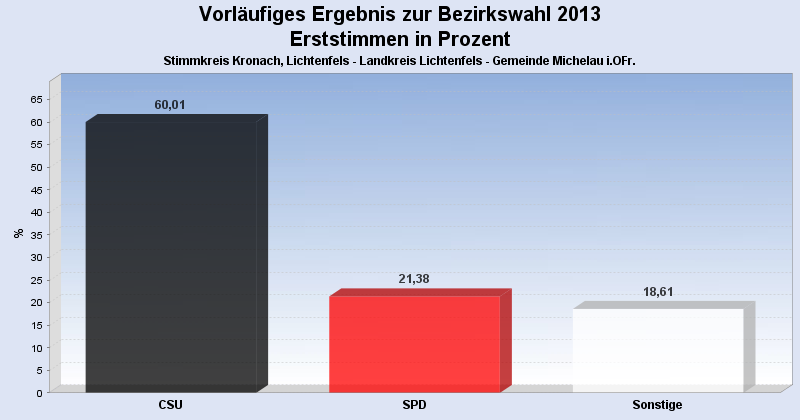
 Seitenanfang
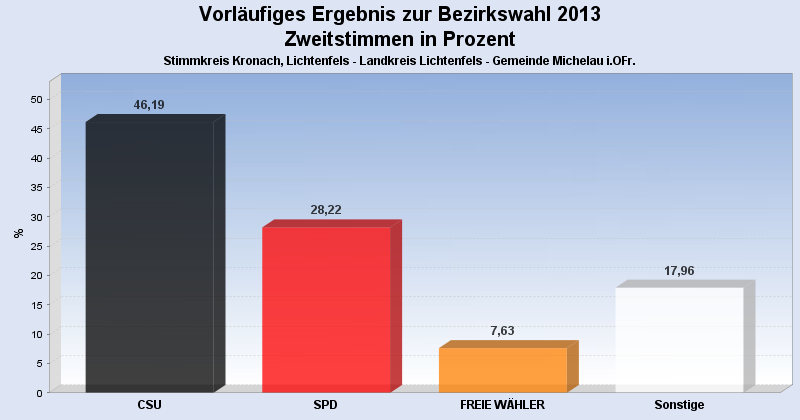
Wahlbeteiligung, Stimmzettel, Stimmen
| Wahlbeteiligung: | 57,39% |
|---|---|
| Stimmberechtigte: | 5.323 |
| Wähler: | 3.055 |
| Ungültige Erststimmen: | 29 |
| Gültige Erststimmen: | 3.026 |
| Ungültige Zweitstimmen: | 93 |
| Gültige Zweitstimmen: | 2.962 |
Erststimmen nach Wahlvorschlag
| Partei | Erststimmen | Prozent | |
|---|---|---|---|
| 1 | Meißner, Christian (CSU) | 1.816 | 60,01% |
| 2 | Marr, Oswald (SPD) | 647 | 21,38% |
| 12 | Konrad, Stefan (DIE FRANKEN) | 93 | 3,07% |
| 3 | Löffler, Gerhard (FREIE WÄHLER) | 92 | 3,04% |
| 4 | Wesolek, Helmut (GRÜNE) | 88 | 2,91% |
| 9 | Hühnlein, Johannes (NPD) | 81 | 2,68% |
| 6 | Malm, Stefan (DIE LINKE) | 57 | 1,88% |
| 13 | Bassing, Stefan (PIRATEN) | 51 | 1,69% |
| 10 | Sedlmeyer, Gunther (BP) | 33 | 1,09% |
| 11 | Köstner, Petra (FRAUENLISTE) | 20 | 0,66% |
| 5 | Nehmzow, Irmgard (FDP) | 20 | 0,66% |
| 7 | Müller, Carita (ÖDP) | 17 | 0,56% |
| 8 | Knirsch, Horst (REP) | 11 | 0,36% |
Zweitstimmen nach Wahlvorschlag
| Partei | Zweitstimmen | Prozent | |
|---|---|---|---|
| 1 | CSU | 1.368 | 46,19% |
| 2 | SPD | 836 | 28,22% |
| 3 | FREIE WÄHLER | 226 | 7,63% |
| 12 | DIE FRANKEN | 100 | 3,38% |
| 9 | NPD | 89 | 3,00% |
| 4 | GRÜNE | 88 | 2,97% |
| 13 | PIRATEN | 71 | 2,40% |
| 6 | DIE LINKE | 52 | 1,76% |
| 10 | BP | 32 | 1,08% |
| 11 | FRAUENLISTE | 32 | 1,08% |
| 5 | FDP | 31 | 1,05% |
| 7 | ÖDP | 22 | 0,74% |
| 8 | REP | 15 | 0,51% |
- Stand: 18.09.2013 09:42:06