OK.Wahl
Internetpräsentation
Version 2.2.7
Vorläufiges Ergebnis zur Bezirkswahl 2013 am 15.09.2013
Stimmkreis Kronach, Lichtenfels - Landkreis Lichtenfels - Marktzeuln
Es wurden alle Stimmbezirke ausgewertet.
 Diagramm
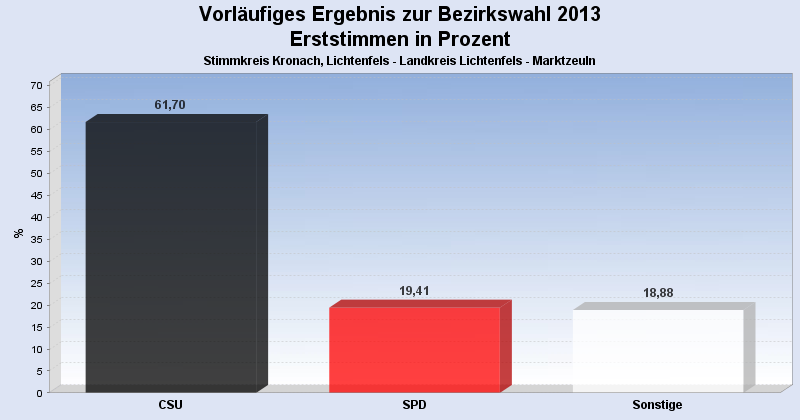
 Seitenanfang
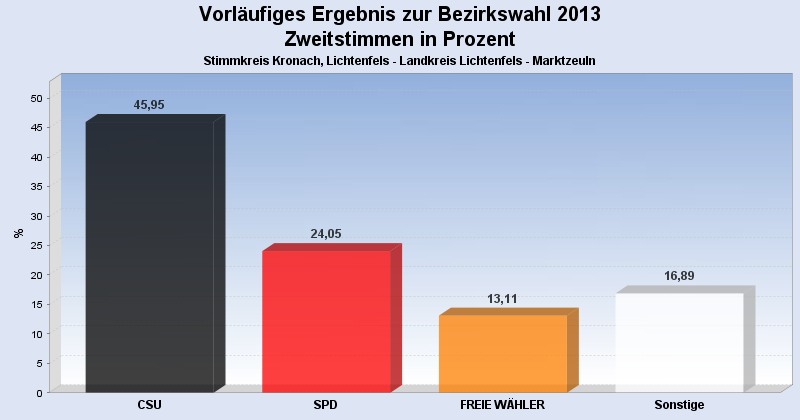
Wahlbeteiligung, Stimmzettel, Stimmen
| Wahlbeteiligung: | 61,04% |
|---|---|
| Stimmberechtigte: | 1.250 |
| Wähler: | 763 |
| Ungültige Erststimmen: | 11 |
| Gültige Erststimmen: | 752 |
| Ungültige Zweitstimmen: | 23 |
| Gültige Zweitstimmen: | 740 |
Erststimmen nach Wahlvorschlag
| Partei | Erststimmen | Prozent | |
|---|---|---|---|
| 1 | Meißner, Christian (CSU) | 464 | 61,70% |
| 2 | Marr, Oswald (SPD) | 146 | 19,41% |
| 3 | Löffler, Gerhard (FREIE WÄHLER) | 34 | 4,52% |
| 4 | Wesolek, Helmut (GRÜNE) | 25 | 3,32% |
| 12 | Konrad, Stefan (DIE FRANKEN) | 19 | 2,53% |
| 7 | Müller, Carita (ÖDP) | 16 | 2,13% |
| 6 | Malm, Stefan (DIE LINKE) | 13 | 1,73% |
| 5 | Nehmzow, Irmgard (FDP) | 11 | 1,46% |
| 9 | Hühnlein, Johannes (NPD) | 9 | 1,20% |
| 13 | Bassing, Stefan (PIRATEN) | 8 | 1,06% |
| 8 | Knirsch, Horst (REP) | 4 | 0,53% |
| 11 | Köstner, Petra (FRAUENLISTE) | 2 | 0,27% |
| 10 | Sedlmeyer, Gunther (BP) | 1 | 0,13% |
Zweitstimmen nach Wahlvorschlag
| Partei | Zweitstimmen | Prozent | |
|---|---|---|---|
| 1 | CSU | 340 | 45,95% |
| 2 | SPD | 178 | 24,05% |
| 3 | FREIE WÄHLER | 97 | 13,11% |
| 4 | GRÜNE | 36 | 4,86% |
| 12 | DIE FRANKEN | 19 | 2,57% |
| 5 | FDP | 16 | 2,16% |
| 6 | DIE LINKE | 12 | 1,62% |
| 13 | PIRATEN | 11 | 1,49% |
| 9 | NPD | 10 | 1,35% |
| 7 | ÖDP | 8 | 1,08% |
| 8 | REP | 7 | 0,95% |
| 11 | FRAUENLISTE | 4 | 0,54% |
| 10 | BP | 2 | 0,27% |
- Stand: 18.09.2013 09:42:04