OK.Wahl
Internetpräsentation
Version 2.2.7
Vorläufiges Ergebnis zur Bezirkswahl 2013 am 15.09.2013
Stimmkreis Kronach, Lichtenfels - Landkreis Lichtenfels - Stadt Lichtenfels
Es wurden alle Stimmbezirke ausgewertet.
 Diagramm
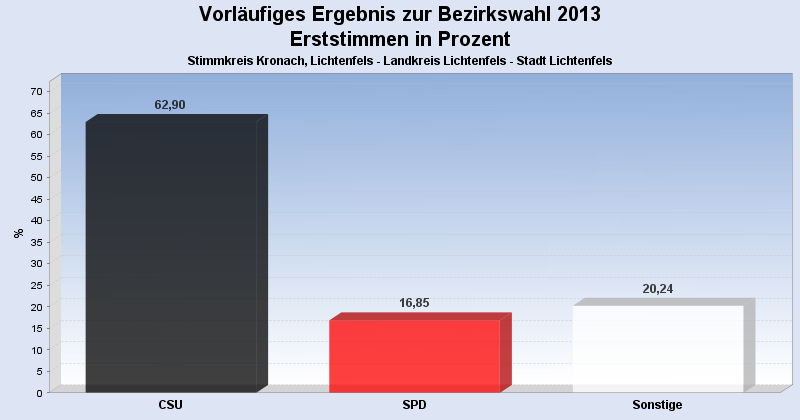
 Seitenanfang
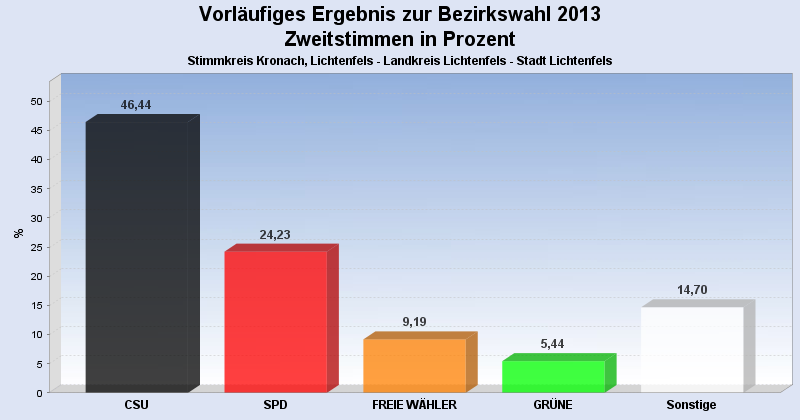
Wahlbeteiligung, Stimmzettel, Stimmen
| Wahlbeteiligung: | 58,45% |
|---|---|
| Stimmberechtigte: | 16.177 |
| Wähler: | 9.455 |
| Ungültige Erststimmen: | 109 |
| Gültige Erststimmen: | 9.346 |
| Ungültige Zweitstimmen: | 288 |
| Gültige Zweitstimmen: | 9.166 |
Erststimmen nach Wahlvorschlag
| Partei | Erststimmen | Prozent | |
|---|---|---|---|
| 1 | Meißner, Christian (CSU) | 5.879 | 62,90% |
| 2 | Marr, Oswald (SPD) | 1.575 | 16,85% |
| 4 | Wesolek, Helmut (GRÜNE) | 450 | 4,81% |
| 3 | Löffler, Gerhard (FREIE WÄHLER) | 383 | 4,10% |
| 12 | Konrad, Stefan (DIE FRANKEN) | 220 | 2,35% |
| 6 | Malm, Stefan (DIE LINKE) | 158 | 1,69% |
| 9 | Hühnlein, Johannes (NPD) | 143 | 1,53% |
| 13 | Bassing, Stefan (PIRATEN) | 141 | 1,51% |
| 5 | Nehmzow, Irmgard (FDP) | 117 | 1,25% |
| 7 | Müller, Carita (ÖDP) | 105 | 1,12% |
| 10 | Sedlmeyer, Gunther (BP) | 74 | 0,79% |
| 11 | Köstner, Petra (FRAUENLISTE) | 61 | 0,65% |
| 8 | Knirsch, Horst (REP) | 40 | 0,43% |
Zweitstimmen nach Wahlvorschlag
| Partei | Zweitstimmen | Prozent | |
|---|---|---|---|
| 1 | CSU | 4.257 | 46,44% |
| 2 | SPD | 2.221 | 24,23% |
| 3 | FREIE WÄHLER | 842 | 9,19% |
| 4 | GRÜNE | 499 | 5,44% |
| 13 | PIRATEN | 252 | 2,75% |
| 12 | DIE FRANKEN | 242 | 2,64% |
| 9 | NPD | 178 | 1,94% |
| 6 | DIE LINKE | 157 | 1,71% |
| 7 | ÖDP | 156 | 1,70% |
| 5 | FDP | 145 | 1,58% |
| 11 | FRAUENLISTE | 87 | 0,95% |
| 10 | BP | 86 | 0,94% |
| 8 | REP | 44 | 0,48% |
- Stand: 18.09.2013 09:41:40