OK.Wahl
Internetpräsentation
Version 2.2.7
Vorläufiges Ergebnis zur Bezirkswahl 2013 am 15.09.2013
Stimmkreis Kronach, Lichtenfels - Landkreis Lichtenfels - Stadt Burgkunstadt
Es wurden alle Stimmbezirke ausgewertet.
 Diagramm
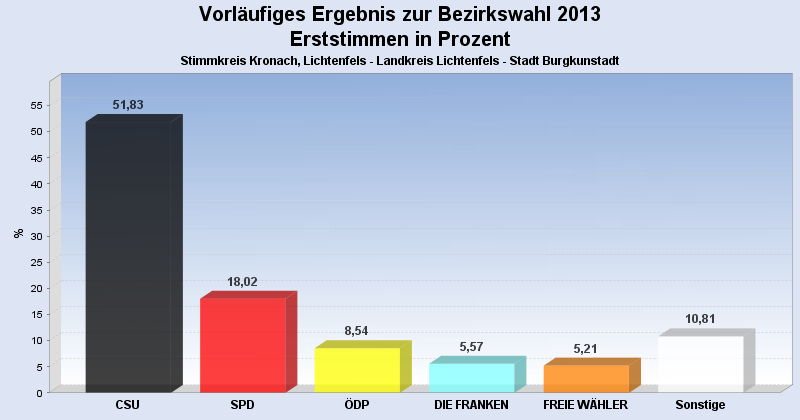
 Seitenanfang
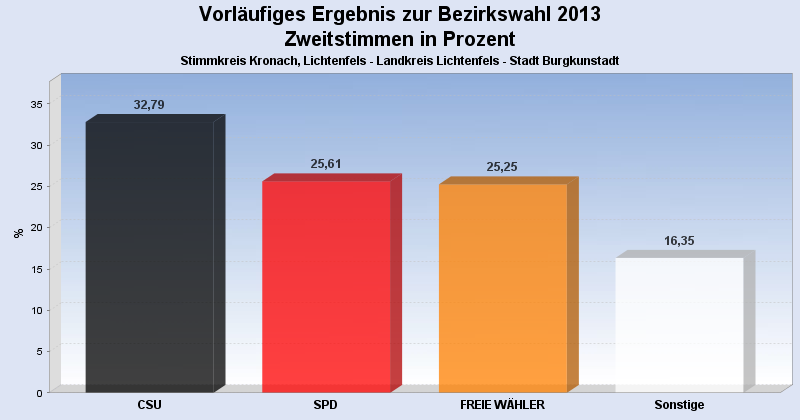
Wahlbeteiligung, Stimmzettel, Stimmen
| Wahlbeteiligung: | 62,41% |
|---|---|
| Stimmberechtigte: | 5.355 |
| Wähler: | 3.342 |
| Ungültige Erststimmen: | 41 |
| Gültige Erststimmen: | 3.301 |
| Ungültige Zweitstimmen: | 82 |
| Gültige Zweitstimmen: | 3.260 |
Erststimmen nach Wahlvorschlag
| Partei | Erststimmen | Prozent | |
|---|---|---|---|
| 1 | Meißner, Christian (CSU) | 1.711 | 51,83% |
| 2 | Marr, Oswald (SPD) | 595 | 18,02% |
| 7 | Müller, Carita (ÖDP) | 282 | 8,54% |
| 12 | Konrad, Stefan (DIE FRANKEN) | 184 | 5,57% |
| 3 | Löffler, Gerhard (FREIE WÄHLER) | 172 | 5,21% |
| 4 | Wesolek, Helmut (GRÜNE) | 95 | 2,88% |
| 6 | Malm, Stefan (DIE LINKE) | 63 | 1,91% |
| 5 | Nehmzow, Irmgard (FDP) | 58 | 1,76% |
| 13 | Bassing, Stefan (PIRATEN) | 56 | 1,70% |
| 9 | Hühnlein, Johannes (NPD) | 43 | 1,30% |
| 10 | Sedlmeyer, Gunther (BP) | 17 | 0,51% |
| 11 | Köstner, Petra (FRAUENLISTE) | 16 | 0,48% |
| 8 | Knirsch, Horst (REP) | 9 | 0,27% |
Zweitstimmen nach Wahlvorschlag
| Partei | Zweitstimmen | Prozent | |
|---|---|---|---|
| 1 | CSU | 1.069 | 32,79% |
| 2 | SPD | 835 | 25,61% |
| 3 | FREIE WÄHLER | 823 | 25,25% |
| 4 | GRÜNE | 135 | 4,14% |
| 12 | DIE FRANKEN | 84 | 2,58% |
| 7 | ÖDP | 71 | 2,18% |
| 13 | PIRATEN | 57 | 1,75% |
| 6 | DIE LINKE | 54 | 1,66% |
| 5 | FDP | 46 | 1,41% |
| 9 | NPD | 42 | 1,29% |
| 11 | FRAUENLISTE | 17 | 0,52% |
| 10 | BP | 14 | 0,43% |
| 8 | REP | 13 | 0,40% |
- Stand: 18.09.2013 09:41:21