OK.Wahl
Internetpräsentation
Version 2.2.7
Vorläufiges Ergebnis zur Bezirkswahl 2013 am 15.09.2013
Stimmkreis Kronach, Lichtenfels - Landkreis Kronach - Gemeinde Weißenbrunn
Es wurden alle Stimmbezirke ausgewertet.
 Diagramm
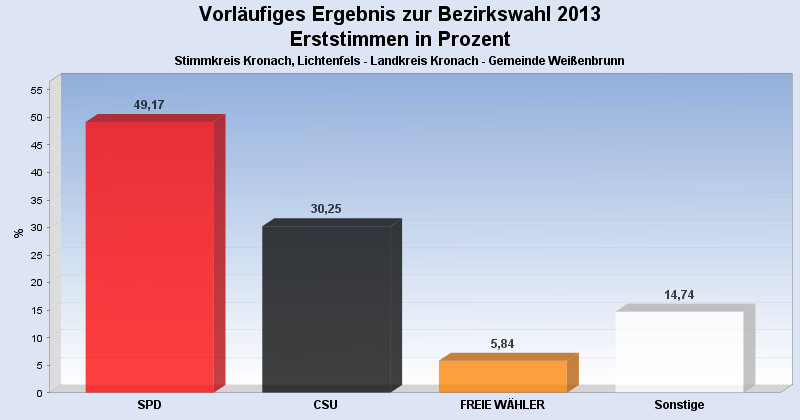
 Seitenanfang
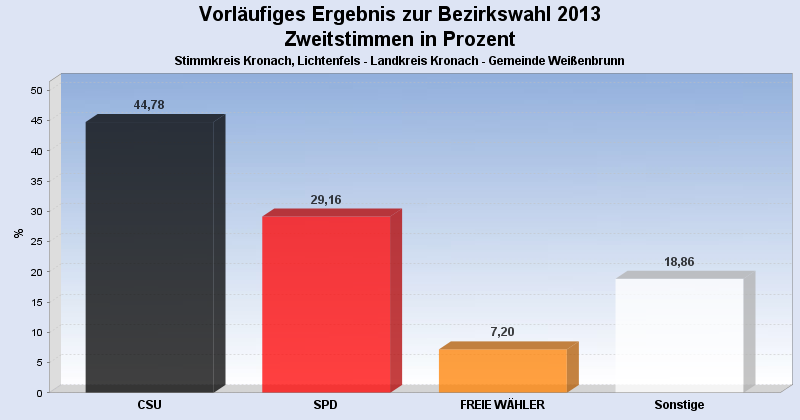
Wahlbeteiligung, Stimmzettel, Stimmen
| Wahlbeteiligung: | 58,81% |
|---|---|
| Stimmberechtigte: | 2.469 |
| Wähler: | 1.452 |
| Ungültige Erststimmen: | 14 |
| Gültige Erststimmen: | 1.438 |
| Ungültige Zweitstimmen: | 63 |
| Gültige Zweitstimmen: | 1.389 |
Erststimmen nach Wahlvorschlag
| Partei | Erststimmen | Prozent | |
|---|---|---|---|
| 2 | Marr, Oswald (SPD) | 707 | 49,17% |
| 1 | Meißner, Christian (CSU) | 435 | 30,25% |
| 3 | Löffler, Gerhard (FREIE WÄHLER) | 84 | 5,84% |
| 4 | Wesolek, Helmut (GRÜNE) | 56 | 3,89% |
| 13 | Bassing, Stefan (PIRATEN) | 39 | 2,71% |
| 9 | Hühnlein, Johannes (NPD) | 26 | 1,81% |
| 6 | Malm, Stefan (DIE LINKE) | 26 | 1,81% |
| 12 | Konrad, Stefan (DIE FRANKEN) | 22 | 1,53% |
| 11 | Köstner, Petra (FRAUENLISTE) | 19 | 1,32% |
| 5 | Nehmzow, Irmgard (FDP) | 11 | 0,76% |
| 8 | Knirsch, Horst (REP) | 5 | 0,35% |
| 10 | Sedlmeyer, Gunther (BP) | 5 | 0,35% |
| 7 | Müller, Carita (ÖDP) | 3 | 0,21% |
Zweitstimmen nach Wahlvorschlag
| Partei | Zweitstimmen | Prozent | |
|---|---|---|---|
| 1 | CSU | 622 | 44,78% |
| 2 | SPD | 405 | 29,16% |
| 3 | FREIE WÄHLER | 100 | 7,20% |
| 11 | FRAUENLISTE | 59 | 4,25% |
| 4 | GRÜNE | 48 | 3,46% |
| 13 | PIRATEN | 33 | 2,38% |
| 12 | DIE FRANKEN | 27 | 1,94% |
| 9 | NPD | 26 | 1,87% |
| 6 | DIE LINKE | 25 | 1,80% |
| 5 | FDP | 21 | 1,51% |
| 7 | ÖDP | 10 | 0,72% |
| 8 | REP | 7 | 0,50% |
| 10 | BP | 6 | 0,43% |
- Stand: 18.09.2013 09:40:47