OK.Wahl
Internetpräsentation
Version 2.2.7
Vorläufiges Ergebnis zur Bezirkswahl 2013 am 15.09.2013
Stimmkreis Kronach, Lichtenfels - Landkreis Kronach
Es wurden alle Stimmbezirke ausgewertet.
 Diagramm
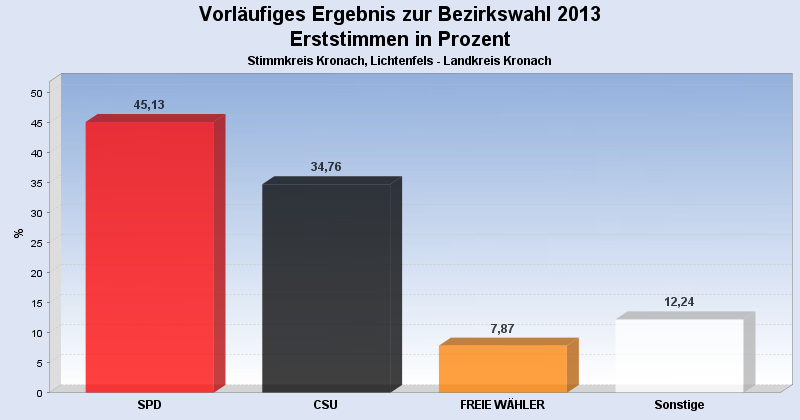
 Seitenanfang
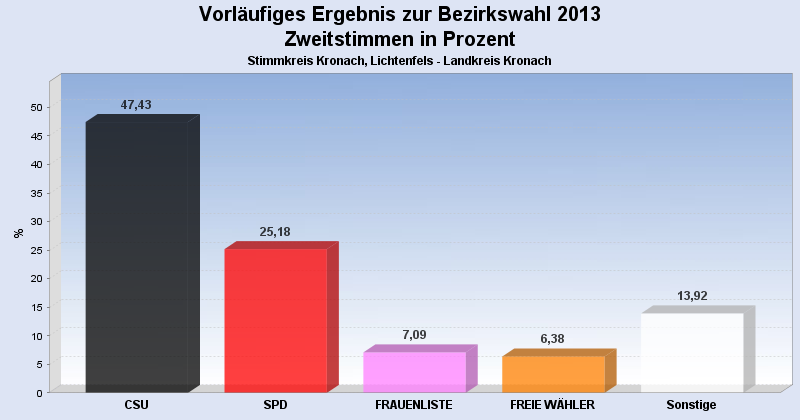
Wahlbeteiligung, Stimmzettel, Stimmen
| Wahlbeteiligung: | 63,32% |
|---|---|
| Stimmberechtigte: | 56.857 |
| Wähler: | 36.004 |
| Ungültige Erststimmen: | 368 |
| Gültige Erststimmen: | 35.635 |
| Ungültige Zweitstimmen: | 1.394 |
| Gültige Zweitstimmen: | 34.607 |
Erststimmen nach Wahlvorschlag
| Partei | Erststimmen | Prozent | |
|---|---|---|---|
| 2 | Marr, Oswald (SPD) | 16.081 | 45,13% |
| 1 | Meißner, Christian (CSU) | 12.386 | 34,76% |
| 3 | Löffler, Gerhard (FREIE WÄHLER) | 2.805 | 7,87% |
| 4 | Wesolek, Helmut (GRÜNE) | 1.049 | 2,94% |
| 12 | Konrad, Stefan (DIE FRANKEN) | 614 | 1,72% |
| 13 | Bassing, Stefan (PIRATEN) | 557 | 1,56% |
| 6 | Malm, Stefan (DIE LINKE) | 542 | 1,52% |
| 11 | Köstner, Petra (FRAUENLISTE) | 486 | 1,36% |
| 9 | Hühnlein, Johannes (NPD) | 479 | 1,34% |
| 5 | Nehmzow, Irmgard (FDP) | 250 | 0,70% |
| 8 | Knirsch, Horst (REP) | 138 | 0,39% |
| 7 | Müller, Carita (ÖDP) | 133 | 0,37% |
| 10 | Sedlmeyer, Gunther (BP) | 115 | 0,32% |
Zweitstimmen nach Wahlvorschlag
| Partei | Zweitstimmen | Prozent | |
|---|---|---|---|
| 1 | CSU | 16.414 | 47,43% |
| 2 | SPD | 8.713 | 25,18% |
| 11 | FRAUENLISTE | 2.454 | 7,09% |
| 3 | FREIE WÄHLER | 2.209 | 6,38% |
| 4 | GRÜNE | 907 | 2,62% |
| 13 | PIRATEN | 768 | 2,22% |
| 5 | FDP | 746 | 2,16% |
| 12 | DIE FRANKEN | 739 | 2,14% |
| 6 | DIE LINKE | 565 | 1,63% |
| 9 | NPD | 533 | 1,54% |
| 8 | REP | 224 | 0,65% |
| 7 | ÖDP | 182 | 0,53% |
| 10 | BP | 153 | 0,44% |
- Stand: 18.09.2013 09:39:21