OK.Wahl
Internetpräsentation
Version 2.2.7
Vorläufiges Ergebnis zur Bezirkswahl 2013 am 15.09.2013
Stimmkreis Kronach, Lichtenfels - Landkreis Kronach - Marktrodach
Es wurden alle Stimmbezirke ausgewertet.
 Diagramm
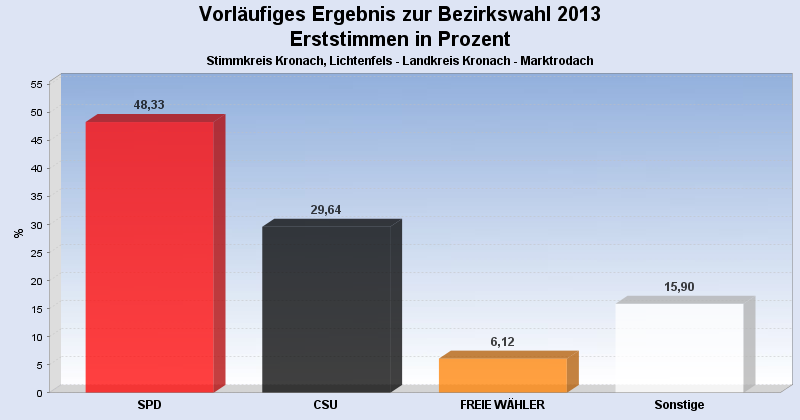
 Seitenanfang
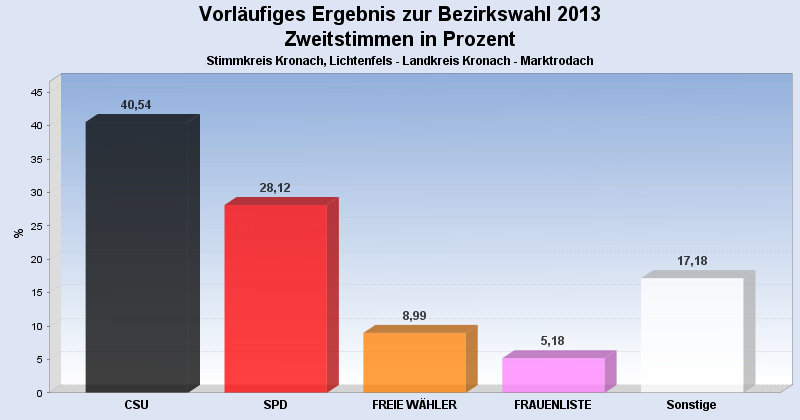
Wahlbeteiligung, Stimmzettel, Stimmen
| Wahlbeteiligung: | 63,17% |
|---|---|
| Stimmberechtigte: | 3.106 |
| Wähler: | 1.962 |
| Ungültige Erststimmen: | 19 |
| Gültige Erststimmen: | 1.943 |
| Ungültige Zweitstimmen: | 70 |
| Gültige Zweitstimmen: | 1.892 |
Erststimmen nach Wahlvorschlag
| Partei | Erststimmen | Prozent | |
|---|---|---|---|
| 2 | Marr, Oswald (SPD) | 939 | 48,33% |
| 1 | Meißner, Christian (CSU) | 576 | 29,64% |
| 3 | Löffler, Gerhard (FREIE WÄHLER) | 119 | 6,12% |
| 4 | Wesolek, Helmut (GRÜNE) | 87 | 4,48% |
| 12 | Konrad, Stefan (DIE FRANKEN) | 39 | 2,01% |
| 6 | Malm, Stefan (DIE LINKE) | 37 | 1,90% |
| 9 | Hühnlein, Johannes (NPD) | 35 | 1,80% |
| 11 | Köstner, Petra (FRAUENLISTE) | 34 | 1,75% |
| 13 | Bassing, Stefan (PIRATEN) | 33 | 1,70% |
| 5 | Nehmzow, Irmgard (FDP) | 16 | 0,82% |
| 7 | Müller, Carita (ÖDP) | 12 | 0,62% |
| 8 | Knirsch, Horst (REP) | 8 | 0,41% |
| 10 | Sedlmeyer, Gunther (BP) | 8 | 0,41% |
Zweitstimmen nach Wahlvorschlag
| Partei | Zweitstimmen | Prozent | |
|---|---|---|---|
| 1 | CSU | 767 | 40,54% |
| 2 | SPD | 532 | 28,12% |
| 3 | FREIE WÄHLER | 170 | 8,99% |
| 11 | FRAUENLISTE | 98 | 5,18% |
| 4 | GRÜNE | 71 | 3,75% |
| 12 | DIE FRANKEN | 53 | 2,80% |
| 5 | FDP | 51 | 2,70% |
| 13 | PIRATEN | 40 | 2,11% |
| 9 | NPD | 38 | 2,01% |
| 6 | DIE LINKE | 31 | 1,64% |
| 7 | ÖDP | 16 | 0,85% |
| 8 | REP | 14 | 0,74% |
| 10 | BP | 11 | 0,58% |
- Stand: 18.09.2013 09:39:55