OK.Wahl
Internetpräsentation
Version 2.2.7
Vorläufiges Ergebnis zur Bezirkswahl 2013 am 15.09.2013
Stimmkreis Kronach, Lichtenfels - Landkreis Kronach - Stadt Teuschnitz
Es wurden alle Stimmbezirke ausgewertet.
 Diagramm
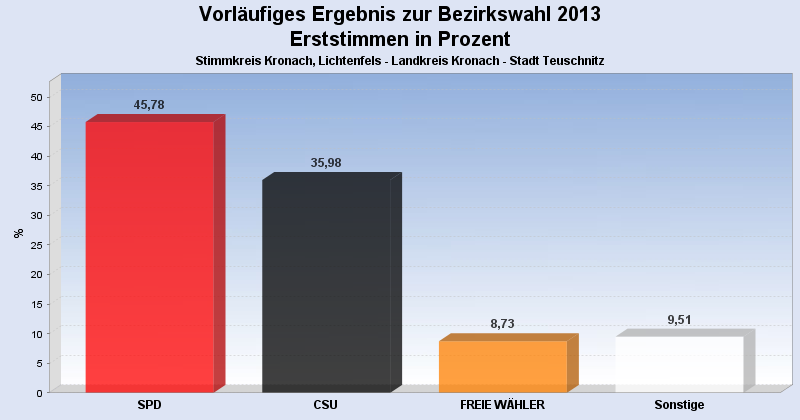
 Seitenanfang
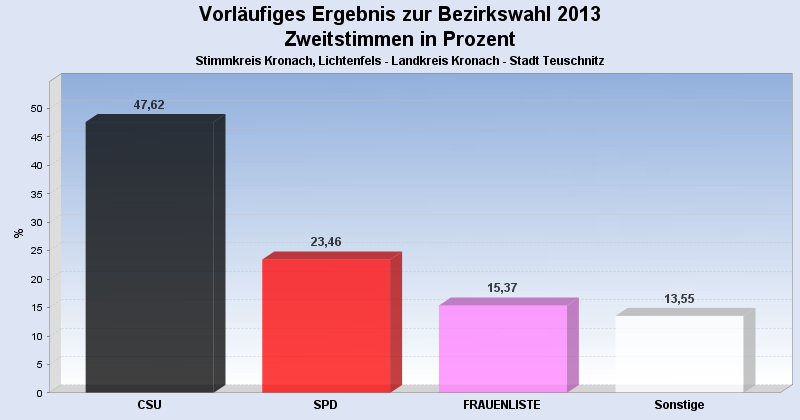
Wahlbeteiligung, Stimmzettel, Stimmen
| Wahlbeteiligung: | 59,43% |
|---|---|
| Stimmberechtigte: | 1.745 |
| Wähler: | 1.037 |
| Ungültige Erststimmen: | 6 |
| Gültige Erststimmen: | 1.031 |
| Ungültige Zweitstimmen: | 48 |
| Gültige Zweitstimmen: | 989 |
Erststimmen nach Wahlvorschlag
| Partei | Erststimmen | Prozent | |
|---|---|---|---|
| 2 | Marr, Oswald (SPD) | 472 | 45,78% |
| 1 | Meißner, Christian (CSU) | 371 | 35,98% |
| 3 | Löffler, Gerhard (FREIE WÄHLER) | 90 | 8,73% |
| 12 | Konrad, Stefan (DIE FRANKEN) | 23 | 2,23% |
| 11 | Köstner, Petra (FRAUENLISTE) | 21 | 2,04% |
| 4 | Wesolek, Helmut (GRÜNE) | 15 | 1,45% |
| 9 | Hühnlein, Johannes (NPD) | 15 | 1,45% |
| 6 | Malm, Stefan (DIE LINKE) | 8 | 0,78% |
| 13 | Bassing, Stefan (PIRATEN) | 6 | 0,58% |
| 8 | Knirsch, Horst (REP) | 3 | 0,29% |
| 10 | Sedlmeyer, Gunther (BP) | 3 | 0,29% |
| 5 | Nehmzow, Irmgard (FDP) | 2 | 0,19% |
| 7 | Müller, Carita (ÖDP) | 2 | 0,19% |
Zweitstimmen nach Wahlvorschlag
| Partei | Zweitstimmen | Prozent | |
|---|---|---|---|
| 1 | CSU | 471 | 47,62% |
| 2 | SPD | 232 | 23,46% |
| 11 | FRAUENLISTE | 152 | 15,37% |
| 3 | FREIE WÄHLER | 29 | 2,93% |
| 12 | DIE FRANKEN | 23 | 2,33% |
| 4 | GRÜNE | 20 | 2,02% |
| 9 | NPD | 17 | 1,72% |
| 5 | FDP | 12 | 1,21% |
| 13 | PIRATEN | 10 | 1,01% |
| 8 | REP | 9 | 0,91% |
| 6 | DIE LINKE | 8 | 0,81% |
| 10 | BP | 4 | 0,40% |
| 7 | ÖDP | 2 | 0,20% |
- Stand: 18.09.2013 09:40:38