OK.Wahl
Internetpräsentation
Version 2.2.7
Vorläufiges Ergebnis zur Bezirkswahl 2013 am 15.09.2013
Stimmkreis Kronach, Lichtenfels - Landkreis Kronach - Markt Tettau
Es wurden alle Stimmbezirke ausgewertet.
 Diagramm
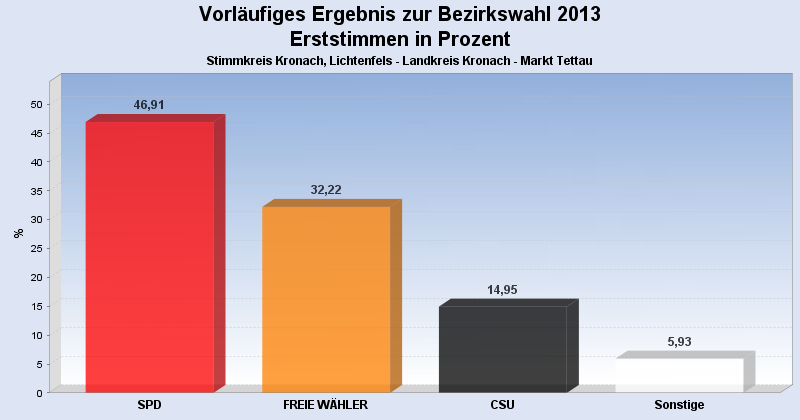
 Seitenanfang
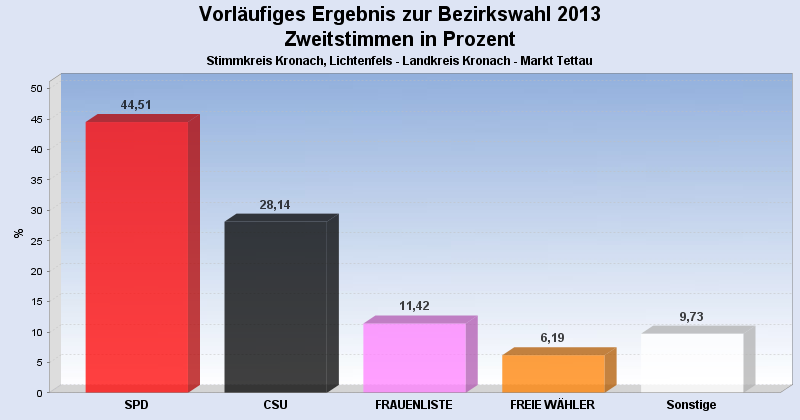
Wahlbeteiligung, Stimmzettel, Stimmen
| Wahlbeteiligung: | 67,20% |
|---|---|
| Stimmberechtigte: | 1.750 |
| Wähler: | 1.176 |
| Ungültige Erststimmen: | 12 |
| Gültige Erststimmen: | 1.164 |
| Ungültige Zweitstimmen: | 46 |
| Gültige Zweitstimmen: | 1.130 |
Erststimmen nach Wahlvorschlag
| Partei | Erststimmen | Prozent | |
|---|---|---|---|
| 2 | Marr, Oswald (SPD) | 546 | 46,91% |
| 3 | Löffler, Gerhard (FREIE WÄHLER) | 375 | 32,22% |
| 1 | Meißner, Christian (CSU) | 174 | 14,95% |
| 4 | Wesolek, Helmut (GRÜNE) | 20 | 1,72% |
| 13 | Bassing, Stefan (PIRATEN) | 13 | 1,12% |
| 9 | Hühnlein, Johannes (NPD) | 10 | 0,86% |
| 6 | Malm, Stefan (DIE LINKE) | 8 | 0,69% |
| 12 | Konrad, Stefan (DIE FRANKEN) | 7 | 0,60% |
| 11 | Köstner, Petra (FRAUENLISTE) | 3 | 0,26% |
| 8 | Knirsch, Horst (REP) | 3 | 0,26% |
| 5 | Nehmzow, Irmgard (FDP) | 2 | 0,17% |
| 7 | Müller, Carita (ÖDP) | 2 | 0,17% |
| 10 | Sedlmeyer, Gunther (BP) | 1 | 0,09% |
Zweitstimmen nach Wahlvorschlag
| Partei | Zweitstimmen | Prozent | |
|---|---|---|---|
| 2 | SPD | 503 | 44,51% |
| 1 | CSU | 318 | 28,14% |
| 11 | FRAUENLISTE | 129 | 11,42% |
| 3 | FREIE WÄHLER | 70 | 6,19% |
| 4 | GRÜNE | 24 | 2,12% |
| 13 | PIRATEN | 20 | 1,77% |
| 5 | FDP | 18 | 1,59% |
| 12 | DIE FRANKEN | 14 | 1,24% |
| 6 | DIE LINKE | 12 | 1,06% |
| 9 | NPD | 11 | 0,97% |
| 7 | ÖDP | 5 | 0,44% |
| 8 | REP | 4 | 0,35% |
| 10 | BP | 2 | 0,18% |
- Stand: 18.09.2013 09:40:33