OK.Wahl
Internetpräsentation
Version 2.2.7
Vorläufiges Ergebnis zur Bezirkswahl 2013 am 15.09.2013
Stimmkreis Kronach, Lichtenfels - Landkreis Kronach - Markt Steinwiesen
Es wurden alle Stimmbezirke ausgewertet.
 Diagramm
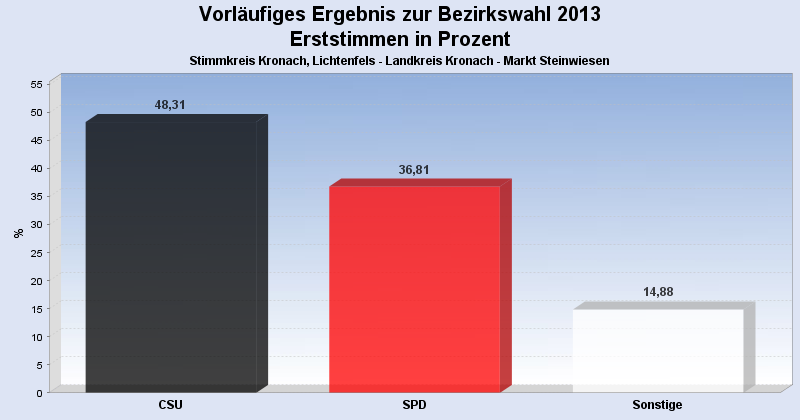
 Seitenanfang
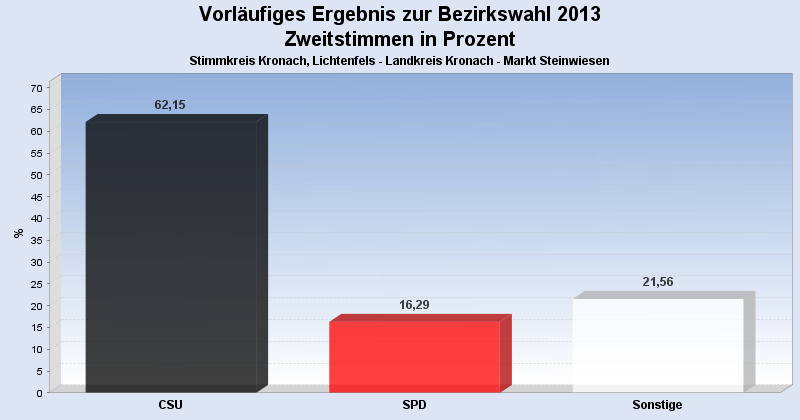
Wahlbeteiligung, Stimmzettel, Stimmen
| Wahlbeteiligung: | 70,17% |
|---|---|
| Stimmberechtigte: | 2.943 |
| Wähler: | 2.065 |
| Ungültige Erststimmen: | 22 |
| Gültige Erststimmen: | 2.043 |
| Ungültige Zweitstimmen: | 94 |
| Gültige Zweitstimmen: | 1.971 |
Erststimmen nach Wahlvorschlag
| Partei | Erststimmen | Prozent | |
|---|---|---|---|
| 1 | Meißner, Christian (CSU) | 987 | 48,31% |
| 2 | Marr, Oswald (SPD) | 752 | 36,81% |
| 3 | Löffler, Gerhard (FREIE WÄHLER) | 66 | 3,23% |
| 4 | Wesolek, Helmut (GRÜNE) | 55 | 2,69% |
| 12 | Konrad, Stefan (DIE FRANKEN) | 51 | 2,50% |
| 9 | Hühnlein, Johannes (NPD) | 36 | 1,76% |
| 13 | Bassing, Stefan (PIRATEN) | 27 | 1,32% |
| 6 | Malm, Stefan (DIE LINKE) | 22 | 1,08% |
| 11 | Köstner, Petra (FRAUENLISTE) | 12 | 0,59% |
| 5 | Nehmzow, Irmgard (FDP) | 11 | 0,54% |
| 8 | Knirsch, Horst (REP) | 10 | 0,49% |
| 7 | Müller, Carita (ÖDP) | 8 | 0,39% |
| 10 | Sedlmeyer, Gunther (BP) | 6 | 0,29% |
Zweitstimmen nach Wahlvorschlag
| Partei | Zweitstimmen | Prozent | |
|---|---|---|---|
| 1 | CSU | 1.225 | 62,15% |
| 2 | SPD | 321 | 16,29% |
| 11 | FRAUENLISTE | 83 | 4,21% |
| 3 | FREIE WÄHLER | 66 | 3,35% |
| 12 | DIE FRANKEN | 66 | 3,35% |
| 13 | PIRATEN | 49 | 2,49% |
| 4 | GRÜNE | 38 | 1,93% |
| 9 | NPD | 37 | 1,88% |
| 5 | FDP | 35 | 1,78% |
| 6 | DIE LINKE | 20 | 1,01% |
| 8 | REP | 15 | 0,76% |
| 7 | ÖDP | 8 | 0,41% |
| 10 | BP | 8 | 0,41% |
- Stand: 18.09.2013 09:40:24