OK.Wahl
Internetpräsentation
Version 2.2.7
Vorläufiges Ergebnis zur Bezirkswahl 2013 am 15.09.2013
Stimmkreis Kronach, Lichtenfels - Landkreis Kronach - Gemeinde Reichenbach
Es wurden alle Stimmbezirke ausgewertet.
 Diagramm
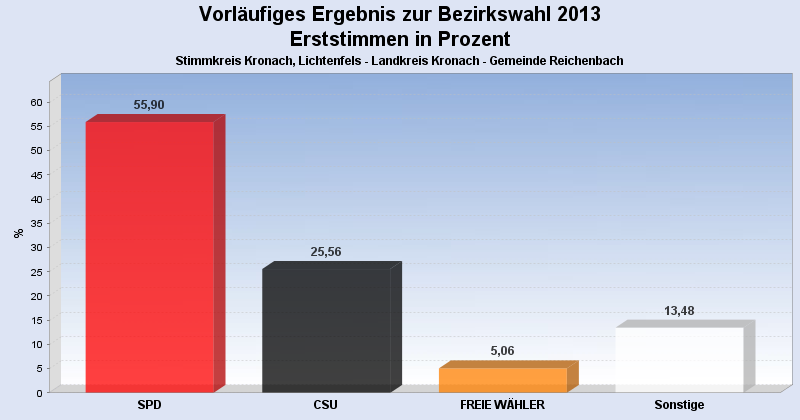
 Seitenanfang
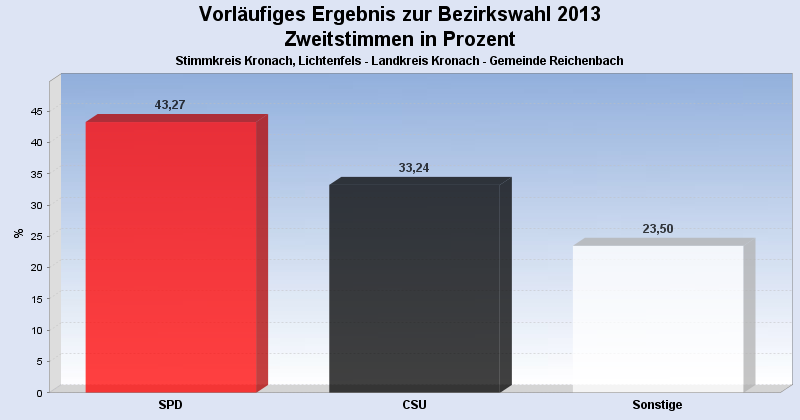
Wahlbeteiligung, Stimmzettel, Stimmen
| Wahlbeteiligung: | 57,90% |
|---|---|
| Stimmberechtigte: | 620 |
| Wähler: | 359 |
| Ungültige Erststimmen: | 3 |
| Gültige Erststimmen: | 356 |
| Ungültige Zweitstimmen: | 10 |
| Gültige Zweitstimmen: | 349 |
Erststimmen nach Wahlvorschlag
| Partei | Erststimmen | Prozent | |
|---|---|---|---|
| 2 | Marr, Oswald (SPD) | 199 | 55,90% |
| 1 | Meißner, Christian (CSU) | 91 | 25,56% |
| 3 | Löffler, Gerhard (FREIE WÄHLER) | 18 | 5,06% |
| 9 | Hühnlein, Johannes (NPD) | 12 | 3,37% |
| 4 | Wesolek, Helmut (GRÜNE) | 8 | 2,25% |
| 12 | Konrad, Stefan (DIE FRANKEN) | 6 | 1,69% |
| 8 | Knirsch, Horst (REP) | 5 | 1,40% |
| 6 | Malm, Stefan (DIE LINKE) | 5 | 1,40% |
| 13 | Bassing, Stefan (PIRATEN) | 5 | 1,40% |
| 11 | Köstner, Petra (FRAUENLISTE) | 2 | 0,56% |
| 5 | Nehmzow, Irmgard (FDP) | 2 | 0,56% |
| 10 | Sedlmeyer, Gunther (BP) | 2 | 0,56% |
| 7 | Müller, Carita (ÖDP) | 1 | 0,28% |
Zweitstimmen nach Wahlvorschlag
| Partei | Zweitstimmen | Prozent | |
|---|---|---|---|
| 2 | SPD | 151 | 43,27% |
| 1 | CSU | 116 | 33,24% |
| 11 | FRAUENLISTE | 15 | 4,30% |
| 9 | NPD | 13 | 3,72% |
| 3 | FREIE WÄHLER | 11 | 3,15% |
| 12 | DIE FRANKEN | 11 | 3,15% |
| 4 | GRÜNE | 7 | 2,01% |
| 8 | REP | 7 | 2,01% |
| 6 | DIE LINKE | 5 | 1,43% |
| 13 | PIRATEN | 4 | 1,15% |
| 5 | FDP | 4 | 1,15% |
| 10 | BP | 4 | 1,15% |
| 7 | ÖDP | 1 | 0,29% |
- Stand: 18.09.2013 09:40:15