OK.Wahl
Internetpräsentation
Version 2.2.7
Vorläufiges Ergebnis zur Bezirkswahl 2013 am 15.09.2013
Stimmkreis Kronach, Lichtenfels - Landkreis Kronach - Markt Nordhalben
Es wurden alle Stimmbezirke ausgewertet.
 Diagramm
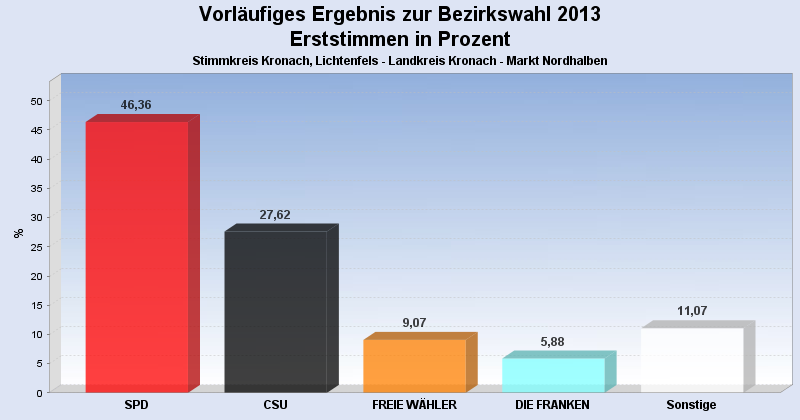
 Seitenanfang
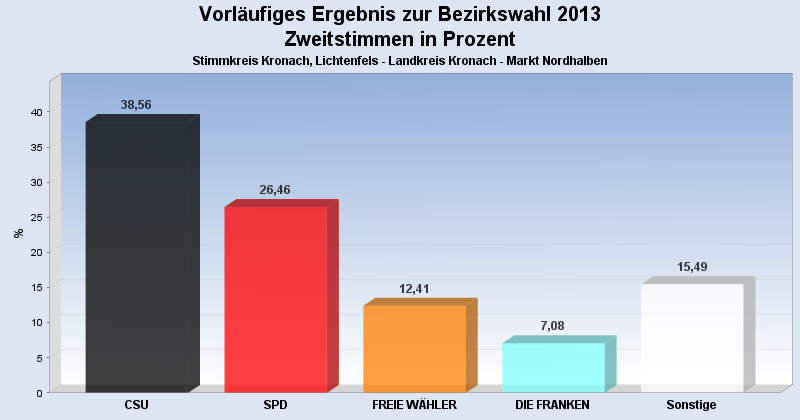
Wahlbeteiligung, Stimmzettel, Stimmen
| Wahlbeteiligung: | 67,36% |
|---|---|
| Stimmberechtigte: | 1.501 |
| Wähler: | 1.011 |
| Ungültige Erststimmen: | 8 |
| Gültige Erststimmen: | 1.003 |
| Ungültige Zweitstimmen: | 36 |
| Gültige Zweitstimmen: | 975 |
Erststimmen nach Wahlvorschlag
| Partei | Erststimmen | Prozent | |
|---|---|---|---|
| 2 | Marr, Oswald (SPD) | 465 | 46,36% |
| 1 | Meißner, Christian (CSU) | 277 | 27,62% |
| 3 | Löffler, Gerhard (FREIE WÄHLER) | 91 | 9,07% |
| 12 | Konrad, Stefan (DIE FRANKEN) | 59 | 5,88% |
| 4 | Wesolek, Helmut (GRÜNE) | 26 | 2,59% |
| 6 | Malm, Stefan (DIE LINKE) | 25 | 2,49% |
| 9 | Hühnlein, Johannes (NPD) | 14 | 1,40% |
| 8 | Knirsch, Horst (REP) | 13 | 1,30% |
| 13 | Bassing, Stefan (PIRATEN) | 13 | 1,30% |
| 11 | Köstner, Petra (FRAUENLISTE) | 10 | 1,00% |
| 5 | Nehmzow, Irmgard (FDP) | 8 | 0,80% |
| 10 | Sedlmeyer, Gunther (BP) | 2 | 0,20% |
| 7 | Müller, Carita (ÖDP) | 0 | 0,00% |
Zweitstimmen nach Wahlvorschlag
| Partei | Zweitstimmen | Prozent | |
|---|---|---|---|
| 1 | CSU | 376 | 38,56% |
| 2 | SPD | 258 | 26,46% |
| 3 | FREIE WÄHLER | 121 | 12,41% |
| 12 | DIE FRANKEN | 69 | 7,08% |
| 11 | FRAUENLISTE | 33 | 3,38% |
| 6 | DIE LINKE | 28 | 2,87% |
| 5 | FDP | 27 | 2,77% |
| 4 | GRÜNE | 18 | 1,85% |
| 8 | REP | 14 | 1,44% |
| 9 | NPD | 13 | 1,33% |
| 13 | PIRATEN | 10 | 1,03% |
| 7 | ÖDP | 6 | 0,62% |
| 10 | BP | 2 | 0,21% |
- Stand: 18.09.2013 09:40:05