OK.Wahl
Internetpräsentation
Version 2.2.7
Vorläufiges Ergebnis zur Bezirkswahl 2013 am 15.09.2013
Stimmkreis Kronach, Lichtenfels - Landkreis Kronach - Markt Mitwitz
Es wurden alle Stimmbezirke ausgewertet.
 Diagramm
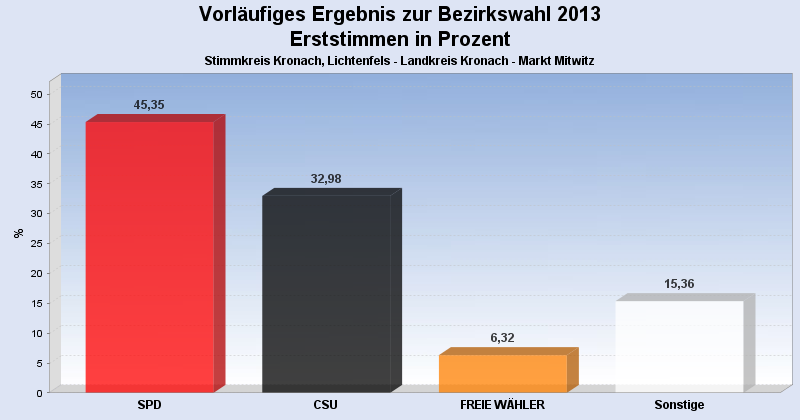
 Seitenanfang
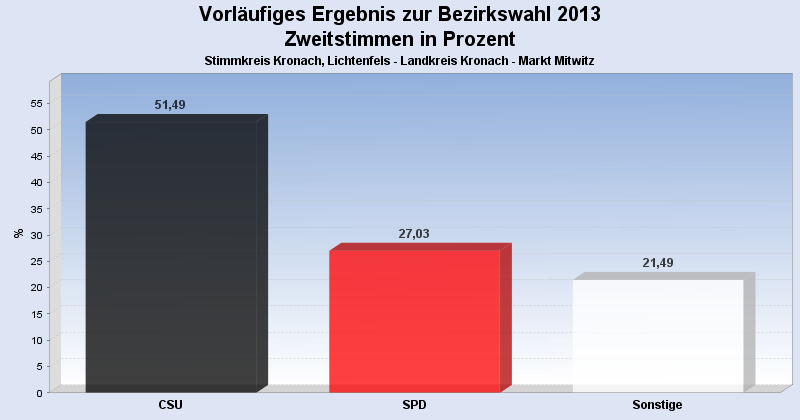
Wahlbeteiligung, Stimmzettel, Stimmen
| Wahlbeteiligung: | 64,58% |
|---|---|
| Stimmberechtigte: | 2.346 |
| Wähler: | 1.515 |
| Ungültige Erststimmen: | 11 |
| Gültige Erststimmen: | 1.504 |
| Ungültige Zweitstimmen: | 35 |
| Gültige Zweitstimmen: | 1.480 |
Erststimmen nach Wahlvorschlag
| Partei | Erststimmen | Prozent | |
|---|---|---|---|
| 2 | Marr, Oswald (SPD) | 682 | 45,35% |
| 1 | Meißner, Christian (CSU) | 496 | 32,98% |
| 3 | Löffler, Gerhard (FREIE WÄHLER) | 95 | 6,32% |
| 4 | Wesolek, Helmut (GRÜNE) | 70 | 4,65% |
| 12 | Konrad, Stefan (DIE FRANKEN) | 32 | 2,13% |
| 6 | Malm, Stefan (DIE LINKE) | 32 | 2,13% |
| 11 | Köstner, Petra (FRAUENLISTE) | 27 | 1,80% |
| 13 | Bassing, Stefan (PIRATEN) | 24 | 1,60% |
| 9 | Hühnlein, Johannes (NPD) | 18 | 1,20% |
| 5 | Nehmzow, Irmgard (FDP) | 11 | 0,73% |
| 7 | Müller, Carita (ÖDP) | 8 | 0,53% |
| 8 | Knirsch, Horst (REP) | 7 | 0,47% |
| 10 | Sedlmeyer, Gunther (BP) | 2 | 0,13% |
Zweitstimmen nach Wahlvorschlag
| Partei | Zweitstimmen | Prozent | |
|---|---|---|---|
| 1 | CSU | 762 | 51,49% |
| 2 | SPD | 400 | 27,03% |
| 3 | FREIE WÄHLER | 71 | 4,80% |
| 4 | GRÜNE | 65 | 4,39% |
| 11 | FRAUENLISTE | 41 | 2,77% |
| 12 | DIE FRANKEN | 30 | 2,03% |
| 6 | DIE LINKE | 29 | 1,96% |
| 13 | PIRATEN | 26 | 1,76% |
| 5 | FDP | 22 | 1,49% |
| 9 | NPD | 17 | 1,15% |
| 7 | ÖDP | 9 | 0,61% |
| 8 | REP | 4 | 0,27% |
| 10 | BP | 4 | 0,27% |
- Stand: 18.09.2013 09:39:59