|
| Kreistagswahl 2008 |
Stand: 04.03.2008 - 16:10:20
Basis: 1 von 1 Ergebnissen
|
|
| WV-Nr | Wahlvorschlag | Stimmen | Prozent | Sitze | WV unveränd. gekennz. |
innerh. eines WV's veränd. |
|---|---|---|---|---|---|---|
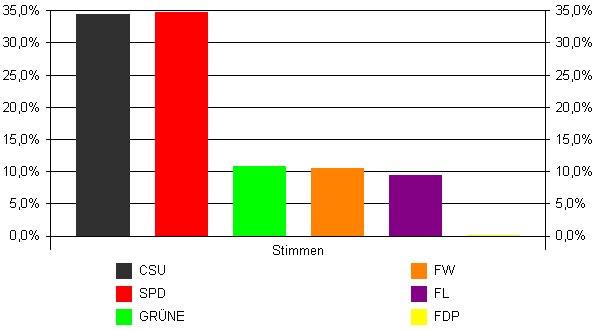
| 01 | Christlich-Soziale Union in Bayern (CSU) | 3260 | 34,36% | 26 | 19 | 6 |
| 02 | Sozialdemokratische Partei Deutschlands (SPD) | 3291 | 34,68% | 19 | 13 | 17 |
| 03 | BÜNDNIS 90/DIE GRÜNEN (GRÜNE) | 1032 | 10,88% | 2 | 8 | 2 |
| 04 | FREIE WÄHLER (FW) | 1001 | 10,55% | 10 | 3 | 2 |
| 05 | FRAUENLISTE - LANDKREIS KRONACH (FL) | 894 | 9,42% | 3 | 5 | 1 |
| 06 | Freie Demokratische Partei (FDP) | 11 | 0,12% | 0 | 0 | 0 |